How Sentiment Analysis Works
In the broadest sense, Sentiment Analysis is all about the measurement of happiness and sadness. How does a particular book make you feel? How does a chapter, or a sentence, or a paragraph make you feel? What about an individual word?
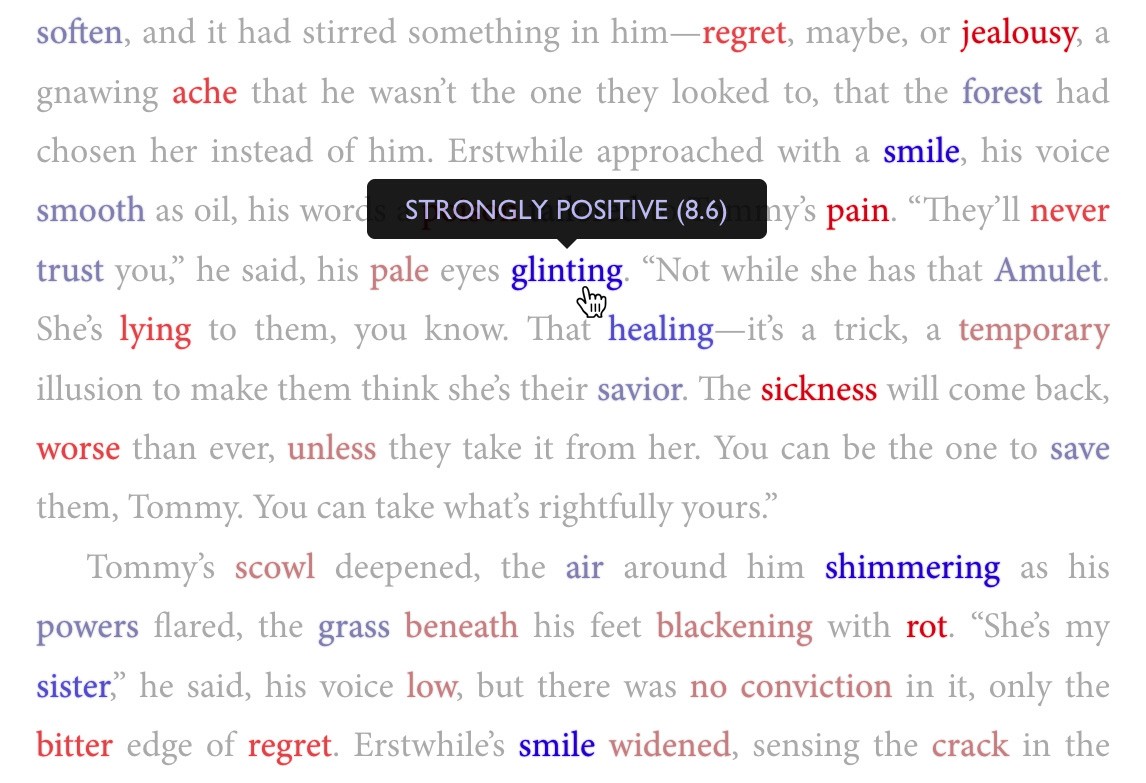
Shaxpir uses its core Sentiment Analysis engine to apply Sentiment Highlighting to the words on your page, so that you can see the most positive and negative words in your vocabulary, right on the page in bold color!
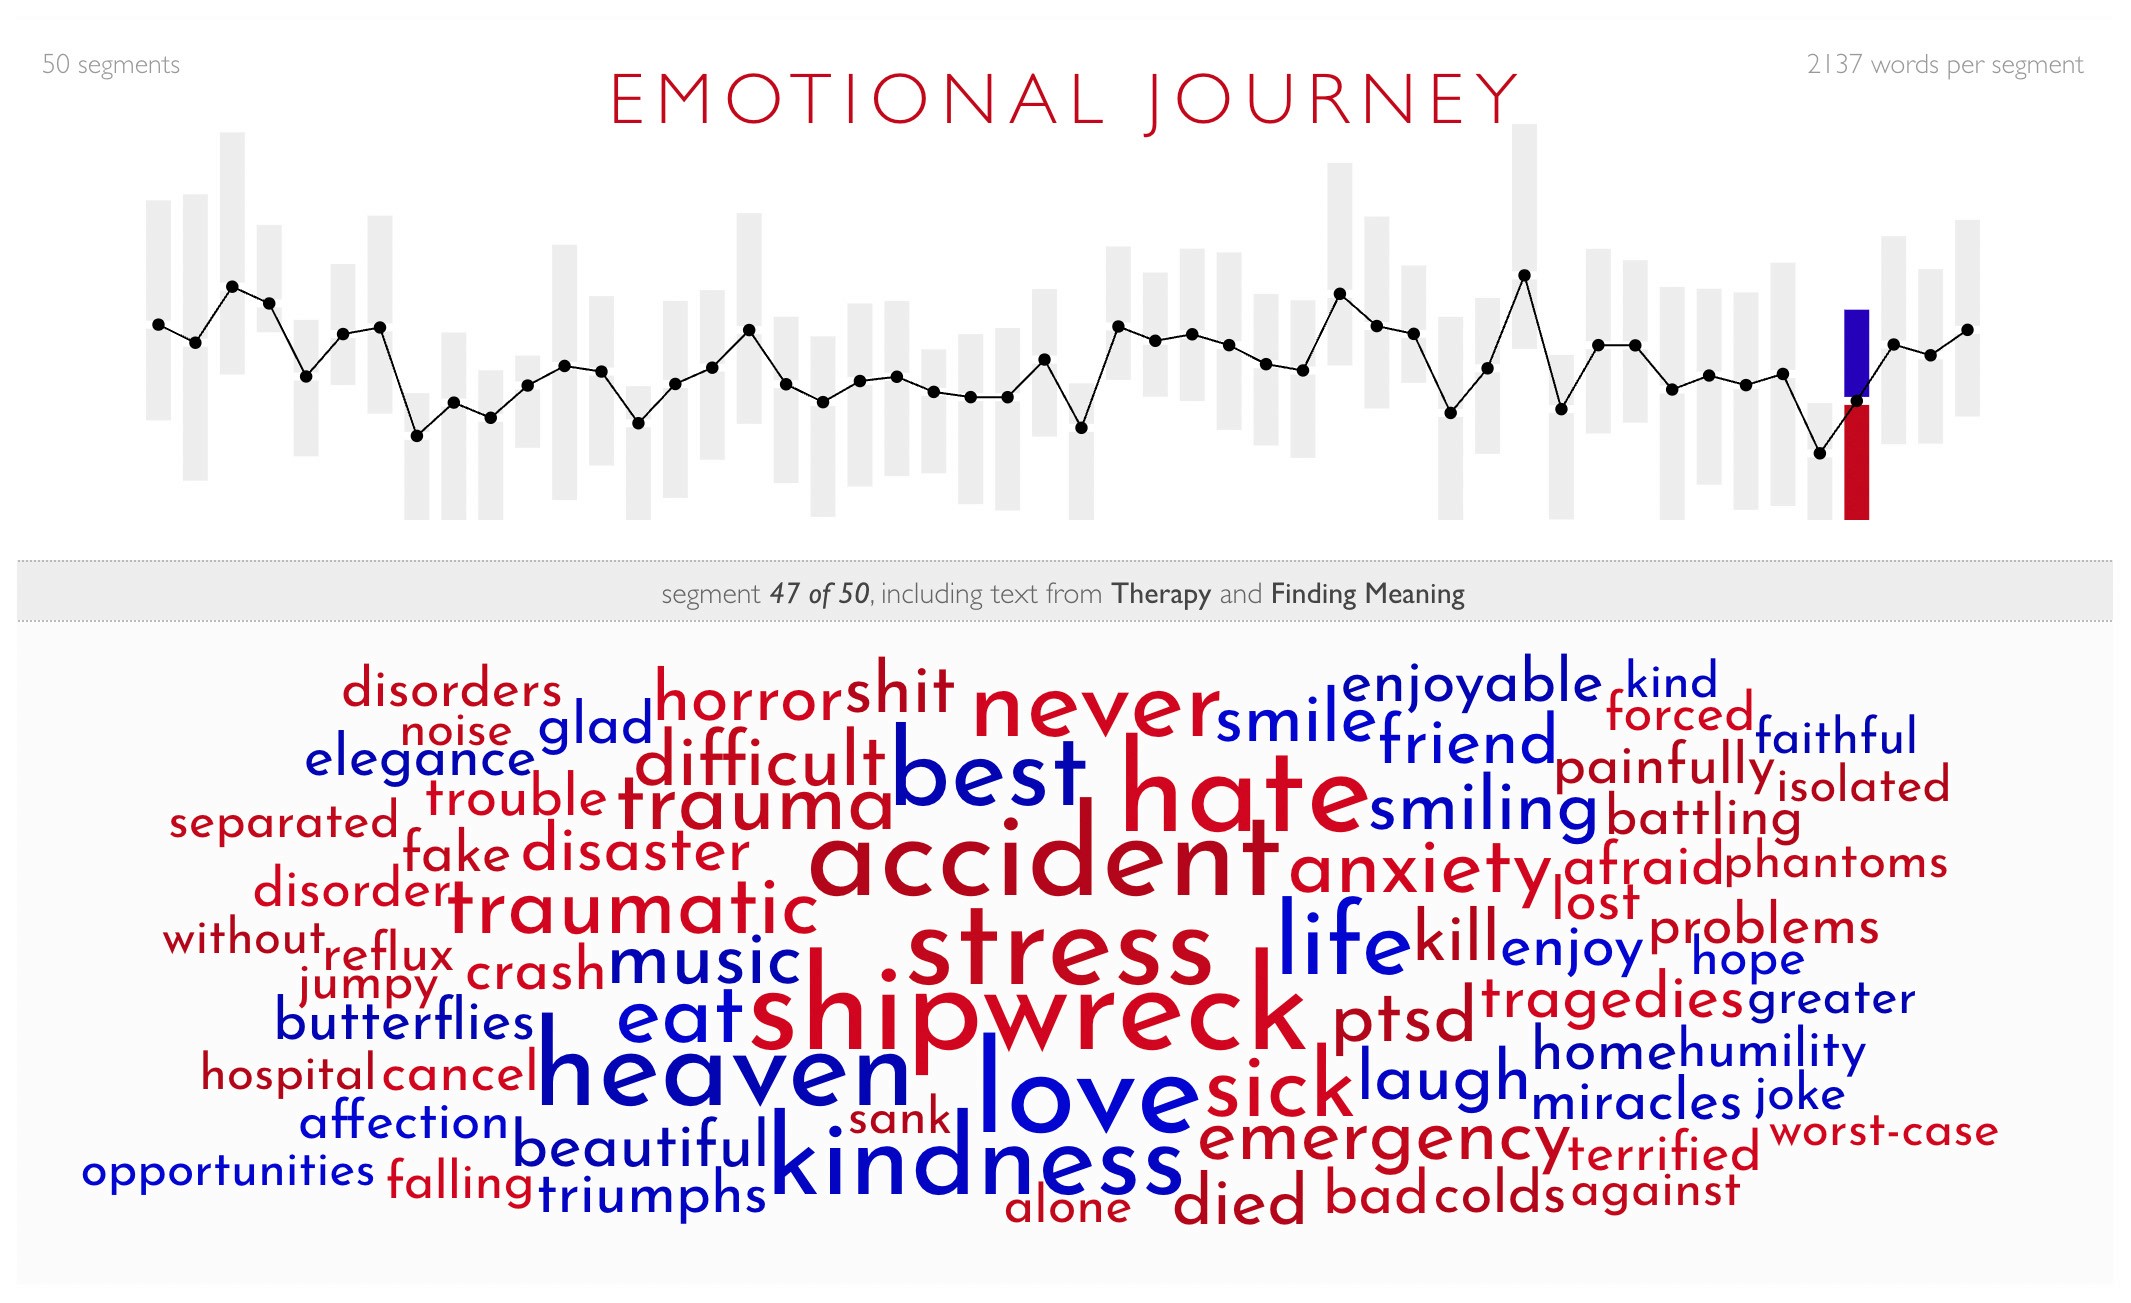
Using the exact same technique, we can tally up all the positive and negative scores from your entire novel, broken down section-by-section, in order to show you how those positive and negative words contribute to the overall ups and downs of your characters’ narrative arc. We can this the Emotional Journey visualization:
In both cases, these tools start with a linguistic definition of “sentiment” and a methodology for measuring sentiment scores across a vocabulary with tens of thousands of unique words.
Sentiment Analysis by Word Scoring
Shaxpir performs Sentiment Analysis on a word-by-word basis. Each word gets its own “sentiment score” on a scale of 1 to 10. Words with low scores — like 1 or 2 — are highly negative (words like: rapist, nazi, hatred). Words with high scores — like 8 or 9 — are highly positive (love, joy, glee). Words near the middle — 4.5 to 6.5 — are neutral: (township, subsequent, deliberate, etc).
These scores can be measured on individual words, or they can be averaged out, over a larger body of text. The technique is the same for a sentence, paragraph, chapter, or an entire novel: add up the scores, and divide by the total number of words.
If you divide a book into sequential chunks of text, and calculate the average positive sentiment and the average negative sentiment for each section, you can use the up-and-down movement of those average scores to understand the emotional structure of the entire book.
In a novel, the sections with the lowest sentiment—the greatest density of “sad words”—tend to be the passages where the main characters are struggling against their most intense challenges. And the sections with the highest average sentiment—the greatest density of “happy words”—tend to be the chapters where the main characters overcome those challenges and enjoy the fruits of their labor. That's how we build the “Emotional Journey” of the book.
But how do we decide which words get which sentiment scores?
Backstory: The Hedonometer
We developed this idea by building upon a research project by the University of Vermont Computational Story Lab. They called it the “Hedonometer”—a way to measure happiness, or “hedonic affect,” as they put it. They started this back in 2009 and published a bunch of research papers about it. Here are some of them:
- 2009: Measuring the Happiness of Large-Scale Written Expression: Songs, Blogs, and Presidents
- 2011: Positivity of the English Language
- 2016: The Emotional Arcs of Stories are Dominated by Six Basic Shapes
- 2018: Temporal Patterns of Happiness and Information in a Global Social Network: Hedonometrics and Twitter
Their approach was pretty straightforward. They gathered billions of tweets from more than 60 million Twitter users. They counted all the words in those tweets and made a dataset of the most common ones. Then they combined that list with similar lists from other sources (Google Books, the New York Times, etc), giving them a grand total of about 10,000 unique words.
Then they recruited an army of human collaborators (Amazon Mechanical Turk Workers). Each person got a random set of 100 words and was asked to assign a “sentiment score” from 1 to 10. Every word went to at least 50 different people, and they averaged all those evaluations to create a composite score for each one. You can see the resultant dataset here:
https://hedonometer.org/words/labMT-en-v2/.
With that list, they could apply their “hedonometric analysis” to anything. In some papers, they looked at the emotional arcs of stories—like Harry Potter and the Deathly Hallows. In others, they mashed together all the tweets from a single day and measured the average sentiment score as a global snapshot of social mood. You can check out their time-series chart here:
https://hedonometer.org/timeseries/en_all/?from=2021-12-30&to=2023-06-29
They operated the project until 2023, when the Twitter API stopped letting third parties collect mass data like that.
Sentiment Analysis in Shaxpir
We first learned about the Hedonometer in 2015 on an episode of Lexicon Valley, a linguistics podcast from Slate.com. They were talking about the researchers’ methodology, and we thought it would make an amazing addition to Shaxpir. So we downloaded their dataset and started using it to analyze literature. But pretty quickly, we ran into problems:
- Their dataset only has about 10,000 words, and it’s mostly sourced from Twitter posts, so it has lot of quippy internet slang and terse abbreviations, not exactly ideal for literary analysis. For fiction, a robust dictionary needs more like 100,000 words.
- Since their dataset is built on “average scores” the averaging process actually dampens the magnitude of extreme samples. Take a word like “laughter” (the most positive word in their dataset). Some people might give it a 10, others a 7 or 8, and when you average it out, it lands at 8.5, nowhere near the top of the scoring system.
- Finally, most of their words—more than 7,000 out of 10,000—end up in the neutral zone: with scores between 4.5 and 6.5. Only about 900 of their words go solidly into the negative (below 3.5) or positive (above 7.5) ranges.
I wanted to resolve all three of these issues, so I started developing my own methodology, building upon their dataset but augmenting it with my own editorial oversight.
Personal Editorial Oversight
This is where we really dug in. We started with the raw Hedonometer dataset and began changing the scores ourselves. We reset the most positive words (laughter, glee, joy, etc) to actually have scores at the top of the range. Likewise, we found the most negative words (rapist, nazi, hatred) and gave them the absolute lowest possible scores. With the extreme scores nailed down, we could begin re-scoring the rest of the words in the Hedonometer dataset.
We personally re-scored over 1,200 of those entries, trying to establish a somewhat more rigorous rubric. Words about hatred and violence (bigotry, murder, torture) got the lowest scores. Words about disease and decay (plague, squalor, overdose) came next. Then words about negative emotions (angry, afraid, jealous).
On the positive side, we put words with deep human satisfaction (joy, love, wonderment) at the very top. Below that, words about nature and pleasant, nourishing ideas (banquet, cheer, cuddling). And below that, words about pleasant sensations and experiences (fancy, buttery, orchestra, intellect).
After rewriting those 1,200 entries, we kept going—adding entirely new words to the vocabulary. Over the past eight years, we’ve put in another 8,500 of our own, one by one, whenever we noticed something missing. Words like “enlightenment,” “rhapsodizing,” “luxuriating,” “shipwreck,” “prankster,” “vermin”—they all found their way in. As of today, the Shaxpir sentiment “ground truth dictionary” has over 18,000 individual scores, a combination of that original publicly-available academic data and our own personal editorial work layered on top.
Machine Learning
Even with over 18,000 entries, that’s still not nearly enough to handle any literary text you throw at it. And besides, how do we know our own editorial choices are consistent?
That’s where machine learning comes in. We took those 18,000 entries—our “sentiment ground truth” database—and used them to train a simple machine learning model on sentiment-scoring. Then we used that model to score a much broader vocabulary, containing more than 100,000 unique words. That’s the algorithm running today. That’s what powers the Sentiment Highlighter and the Emotional Journey visualization. It’s a systematized process of codifying Editorial Oversight into something a machine can optimize.
Each time we add new words to the vocabulary, or tweak the scores in the training set, the model produces a new set of scores with slight variations from the previous batch. You can certainly quibble with any of the individual scores produced by this model — they’re based on subjective opinions and enforced by an imperfect machine-learning process — but when you apply those scores in the aggregate to a body of text, they’re remarkably effective at showing large-scale emotional patterns.
Score Labeling in Shaxpir
Having completed our human-centric labeling of data, and our machine-learning application of those learned human labels onto a broader vocabulary, we apply a set of labeling ranges for labeling in the Shaxpir writing platform (e.g., in the Sentiment Highlighter and in the Emotional Journey visualization). Here's how those scoring ranges work:
- STRONGLY POSITIVE: scores between 8.5 and 10.0
- MODERATELY POSITIVE: scores between 7.5 and 8.5
- MILDLY POSITIVE: scores between 6.5 and 7.5
- NEUTRAL: scores between 4.5 and 6.5
- MILDLY NEGATIVE: scores between 3.5 and 4.5
- MODERATELY NEGATIVE: scores between 2.5 and 3.5
- STRONGLY NEGATIVE: scores between 1.0 and 2.5
The Sentiment Highlighters apply coloring to all words with positive or negative scores, but it avoids applying any coloring to words with neutral scores. The Emotional Journey visualization accumulates all words with moderate and strong scores, while ignoring words with neutral or mild scores.
Wrapping It Up
So that’s it—the whole process. It started with the Hedonometer, grew with my own hands-on work, and got a boost from machine learning. It’s not a mysterious black box; it’s a dataset I’ve spent years shaping. Sign up for Shaxpir Pro and see what it can do for your story—I think you’ll like it!